Contents:
Overview
Grip Pulse allows you to view insights and analytics of your App and Events in near real time.
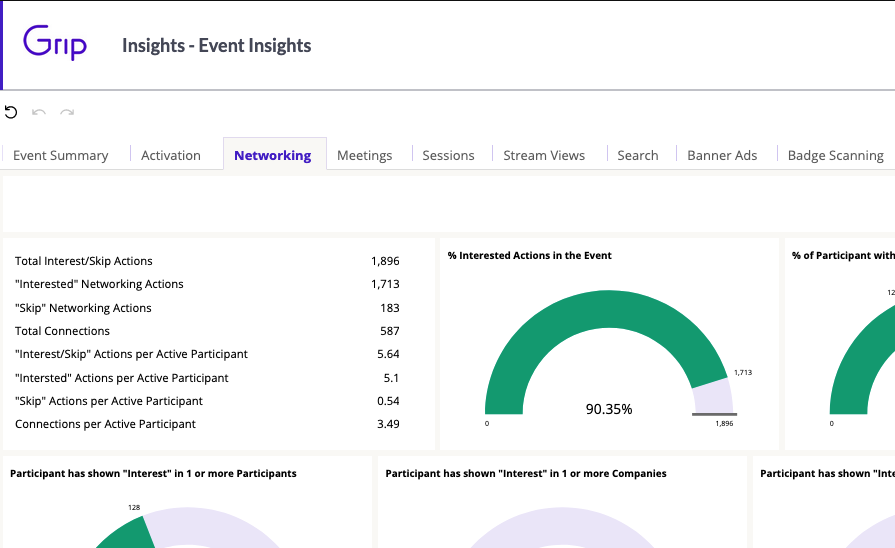
All Events on Grip have access to core information via the Event Insights dashboard. Event Insights provide powerful insights into the behaviors of your event participants. This dashboard shows how they interacted with each other at your event.
You can find details such as badge scanning usage, meeting bookings, and session engagement here. We have grouped these interactions into distinct sections on the dashboard; you can access the different sections by clicking on each tab. Accompanying these sections is a glossary page explaining what some of the terms mean.
Clicking on the Event Insights dashboard will open the dashboard in a new tab in your browser. This will allow you to navigate and manage your event while having access to your insights at the same time. You can also choose to switch to another event and compare insights side by side.
Interacting with Event Insights - slice and dice your data
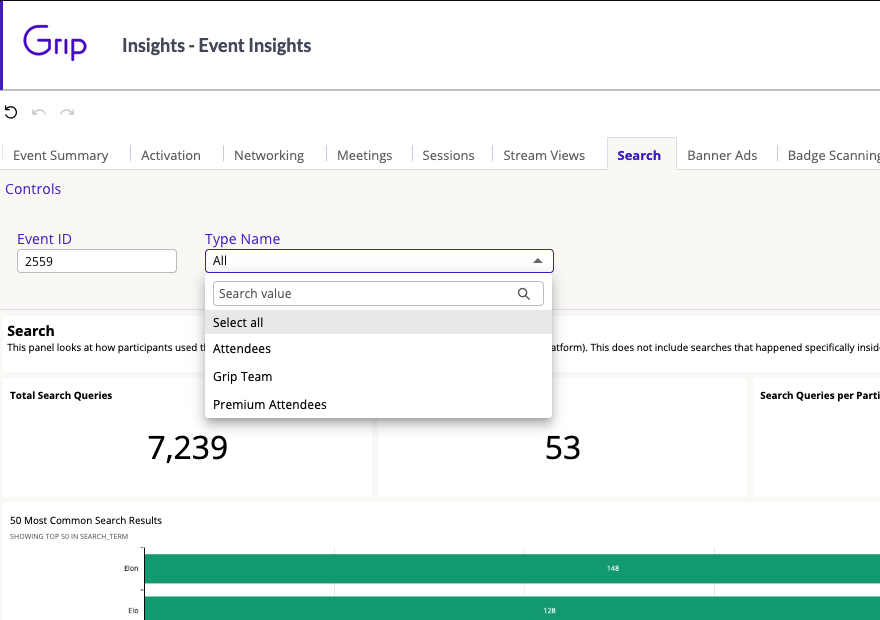
You can interact with some sections of Events Insights by selecting from preset filters or by entering a specific value. For instance, when looking at Search related insights, you can filter the insights, narrowing your view to a specific data type.
You may have noticed that an Event ID field is always set in each section. We recommend that this not be changed or removed to ensure that your view of the data is correct for the current event.
Interacting with Event Insights - exporting raw data
You can export the raw data used for each visualization in the Events Insights dashboard for further analysis. Exports can be made in CSV or Excel file formats. The following limits apply for any exports
- For data tables, you can export only up to 1 million rows or 500 MB of data, whichever limit is reached first.
- For all other visuals, including pivot tables, the limits that apply to exporting are the same limits that apply to the visual type.
- Support for exports is currently restricted to Chrome and Safari browsers.
FAQs
Q: Why can’t I refresh, bookmark, or share my insights page?
A: Each insights page is created using a secure connection to you and you alone. This ensures that sensitive data displayed in your event insight reports remain secure.
Q: Why do the numbers look different from what I expect?
A: Much of our data is streamed into insights in near real time, but there are instances when the data needs to be processed or aggregated with other data sources in order to make sense. This additional processing takes time to complete, depending on which report you are looking at.
Q: Why do I see more active participants in my Insights than my current list of users?
A: The dashboard always reports what is current to your event whereas your insights will track historical participation over time.
One example: a participant may have joined your event and since removed themselves or been removed by you; in this case the participant number in the Events Insights report will be greater than the number shown in the event dashboard.
Q: Are there other insights dashboards available?
A: Yes, other insight dashboards are available. Contact your Grip Sales representative for more details.
Q: Why can’t I see my exports?
A: Check that you are using a Chrome or Safari browser. Support for Firefox is not currently supported.
Q: Why is the 'Connections by Data Type' number often double the total connections?
A: The 'Connections by Data Type' figure may be double the total connections because it counts the connections separately for each participant group involved. If a connection is made between participants from different groups, it is counted once for each group, leading to a higher total in this breakdown.